![]()
Cognos Analytics is an IBM Business Intelligence tool that you can use to interpret your data and extract relevant information for your Database.In this tutorial , we will add a new data source to Cognos Analytics , from DashDB , and create charts. Let’s get started !
What is DashDB ?
DashDB is a data warehouse developed by IBM that you can use to gather data from different databases and different sources.
Connect DashDB to Cognos Analytics
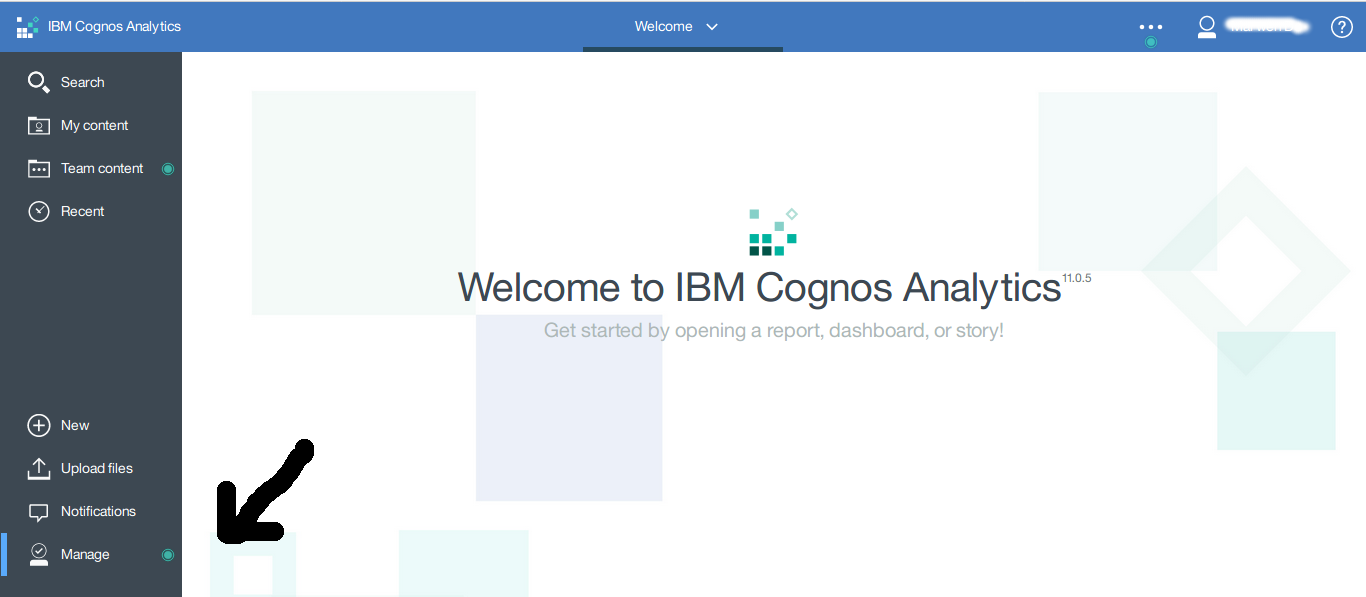
Connect to your Cognos account and click “manage” (in the bottom left) .
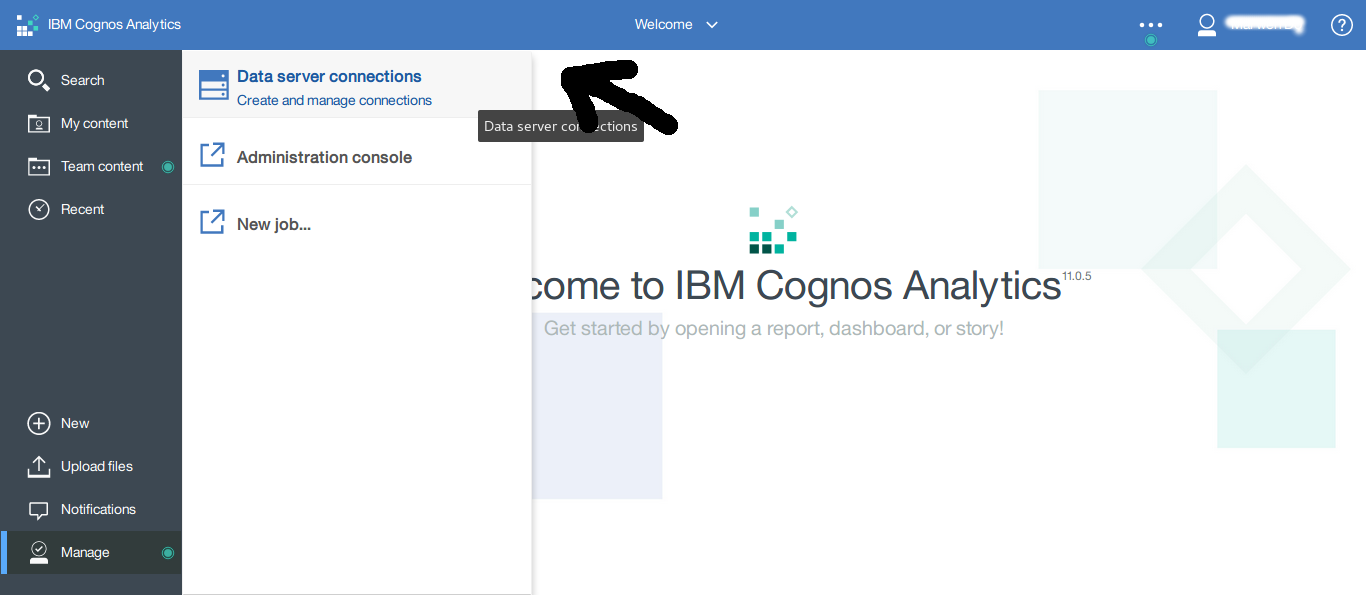
Then , click “Data server connections”
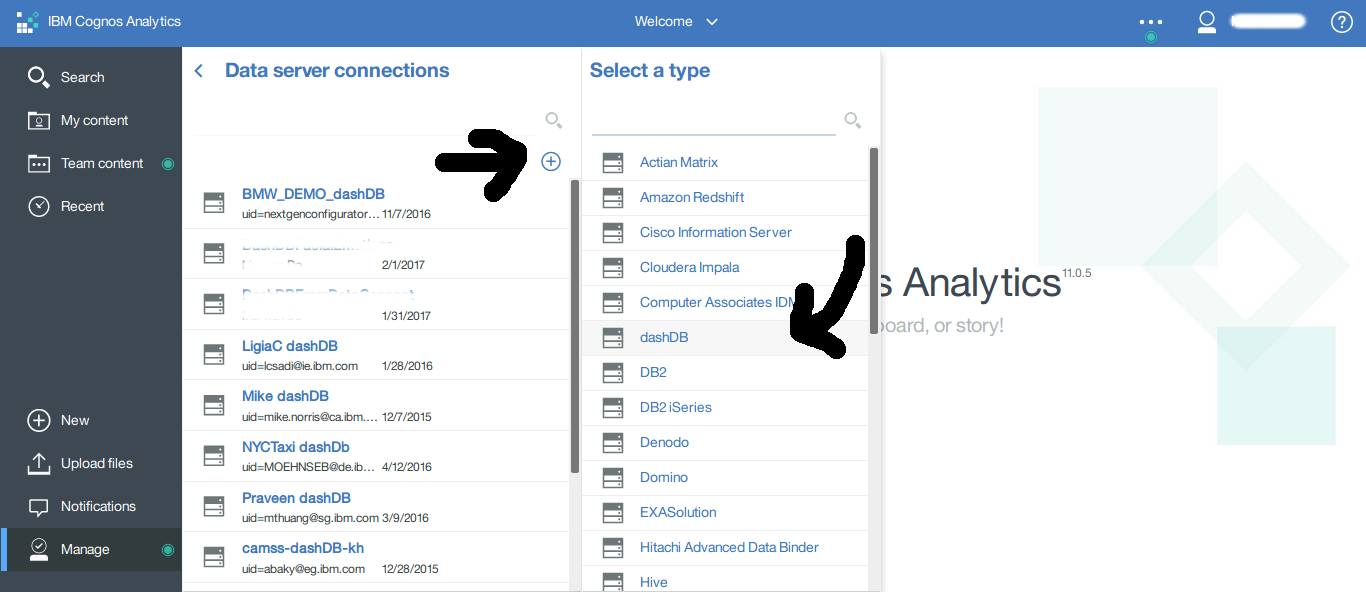
Click the + button and choose DashDB
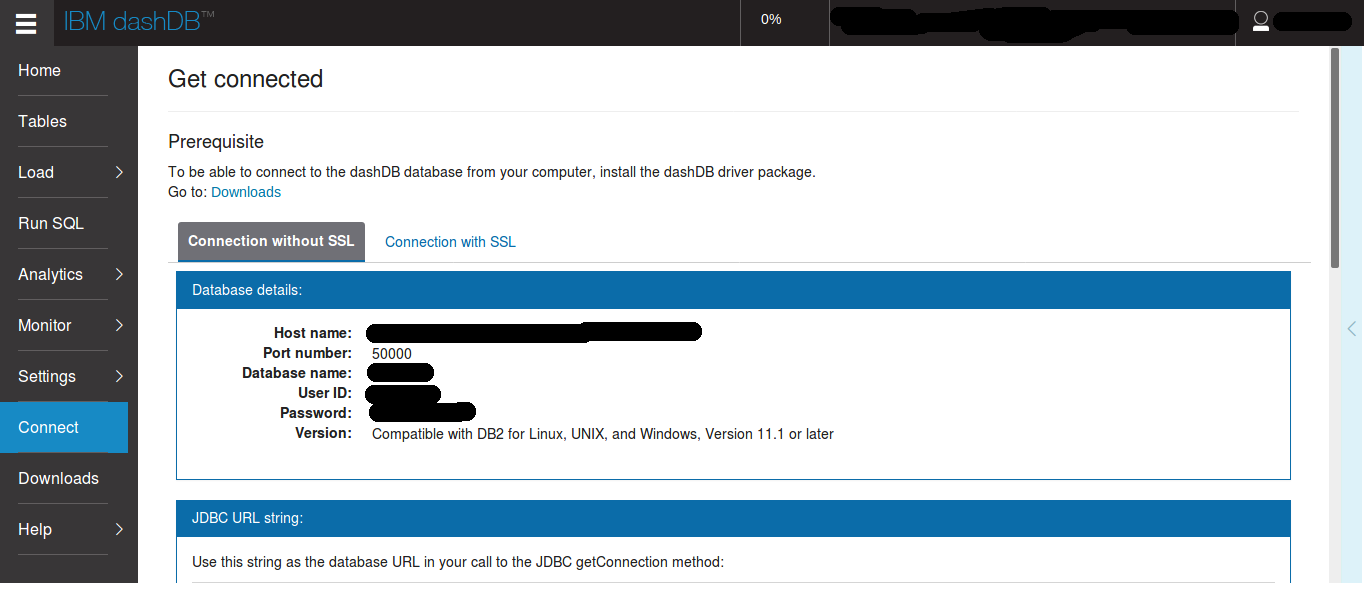
Now , we have to enter the DashDB credentials , so go to your DashDB dashboard , click “connect” and copy , paste the required fields . (copy Host name and paste it in “Server”)
When you’re done , test if the connection can be established by clicking “test” , you should see this
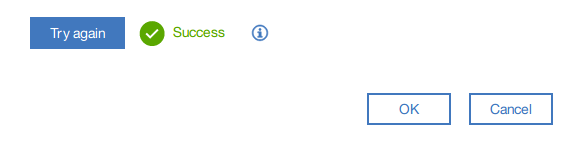
After clicking the “Ok” button , click on the database you just created .
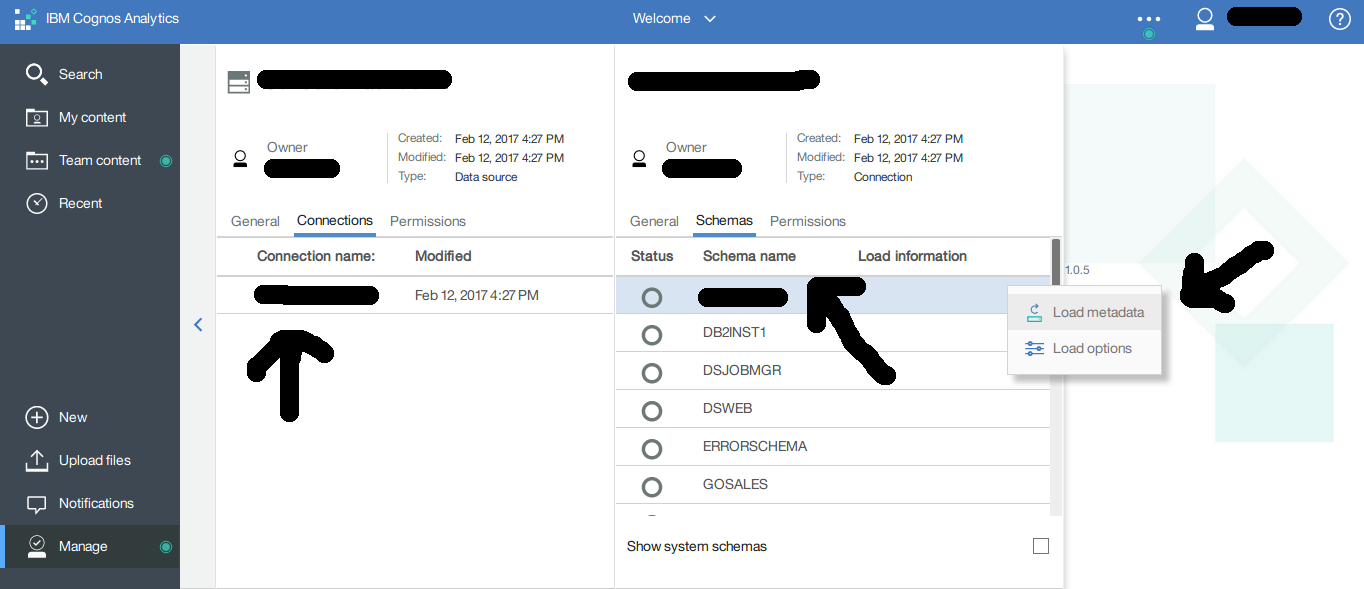
Then click on your connection name , and next to your schema name (DashDB table name) , click “Load metadata”
As of now , we successfully connected Cognos to DashDB . The next step is to create a new data source for Cognos , it will get data from the server connection we just created .
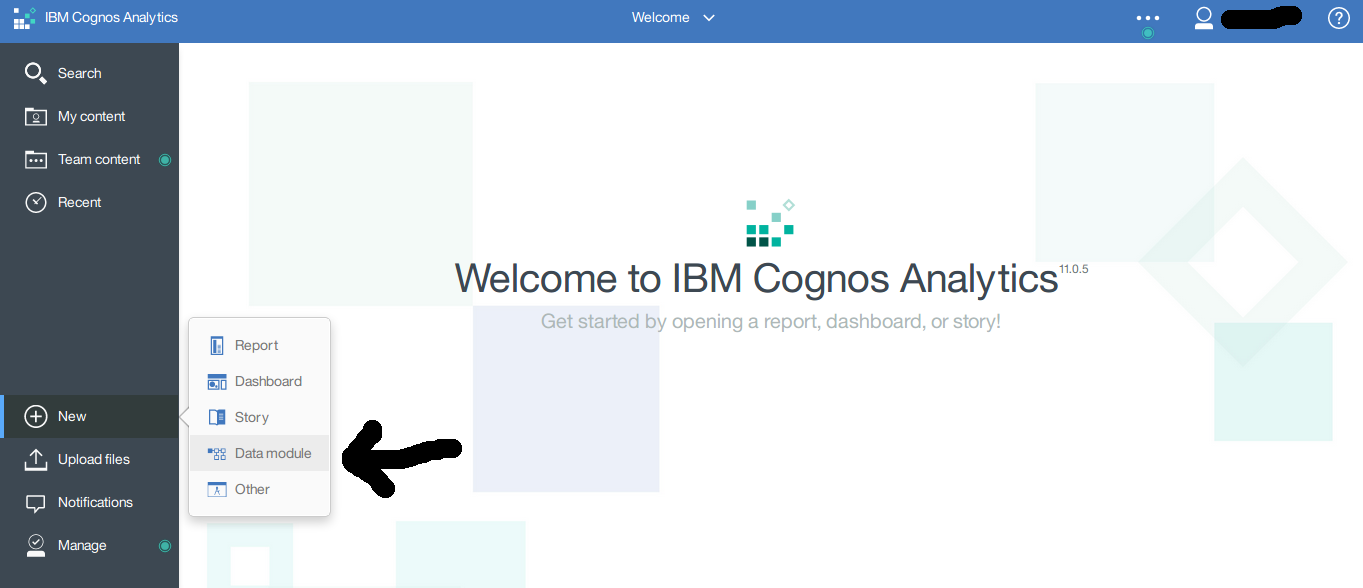
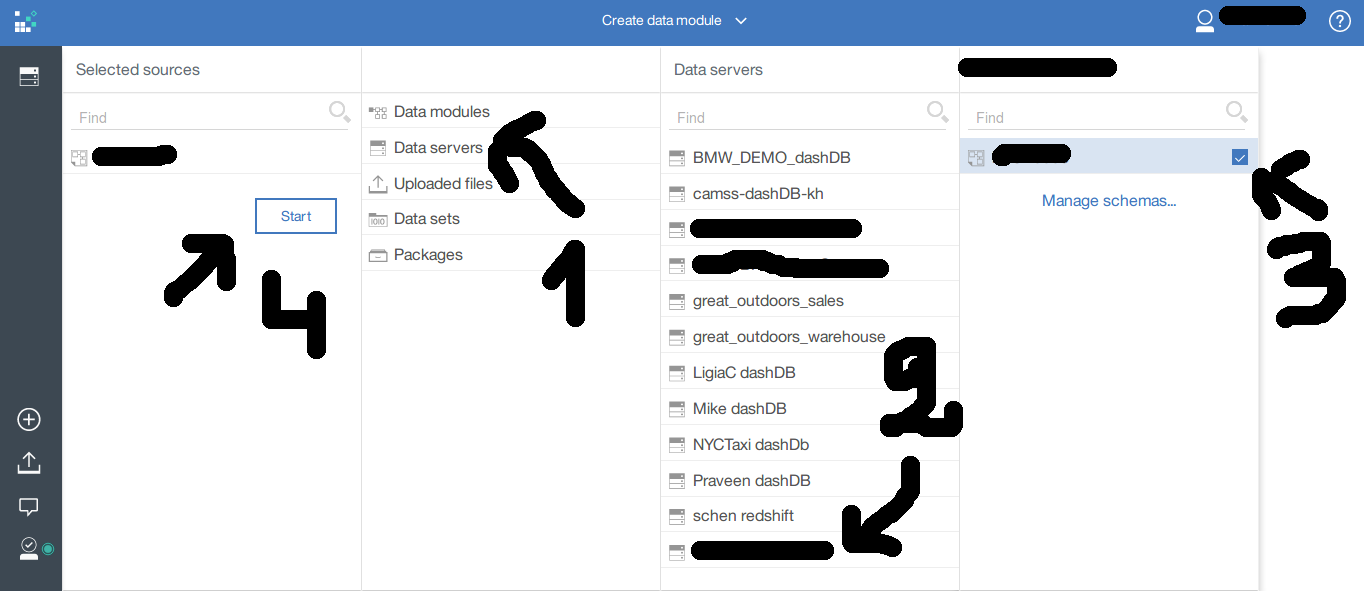
Click the + button and choose “Data module”
Click “Data servers”, then choose the “Data server” we just created .After that check the schema (DashDB table name) , and finally click “Start”.
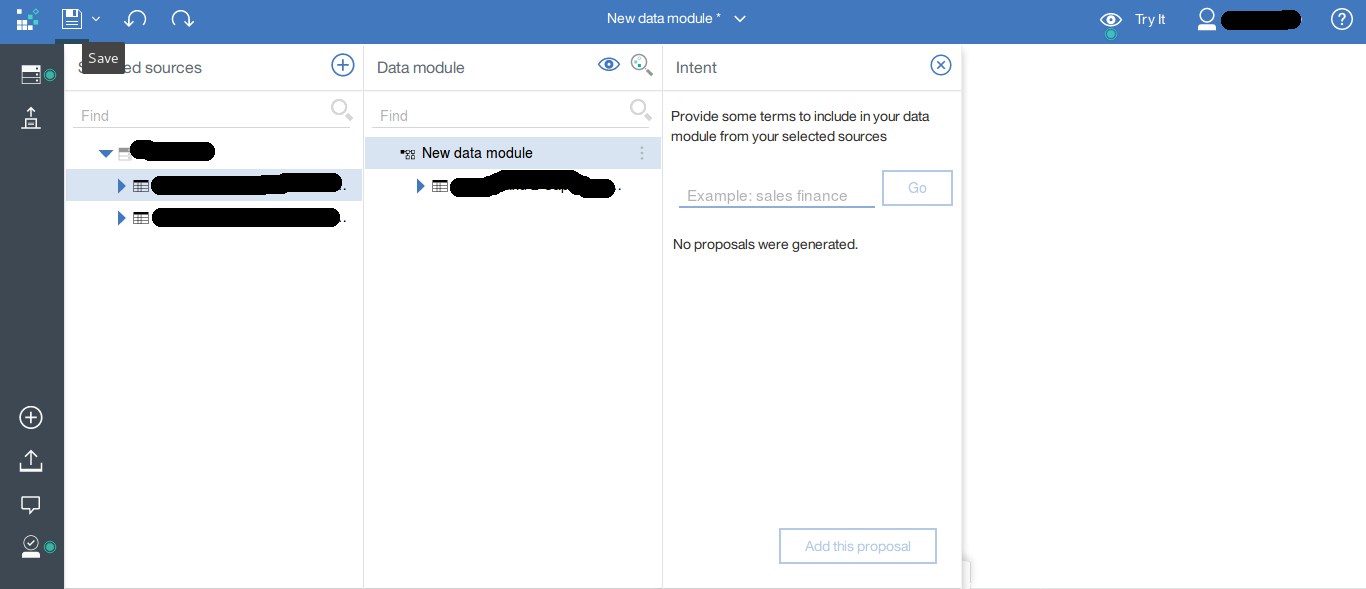
Expand the “Data sources” , then drag and drop the table name you want to work on. Click “save” (on the top left).
Tip: Save it in “My content” folder to make it easier to find it later.
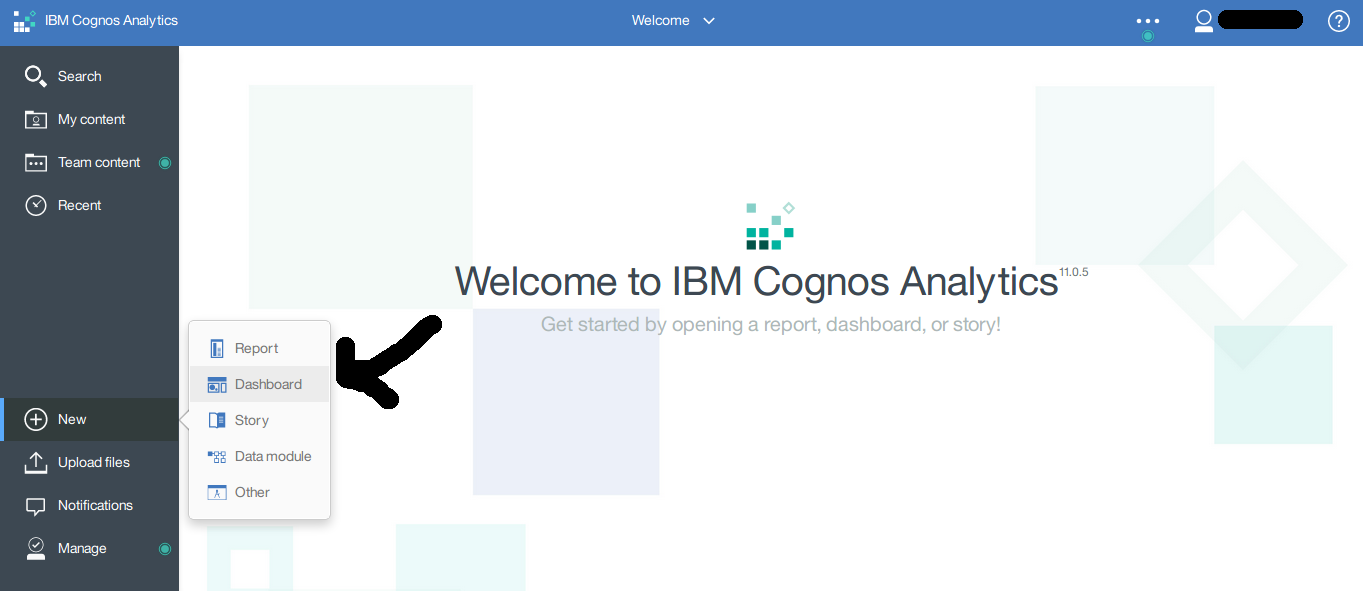
Everything now is well set up . To use those data , add a new Dashboard
In the new dashboard , we need to choose the data we want to process , so click the “+” button and choose the data source we just created (if you followed my tip , you’ll find it in “My content” folder 😉 ).
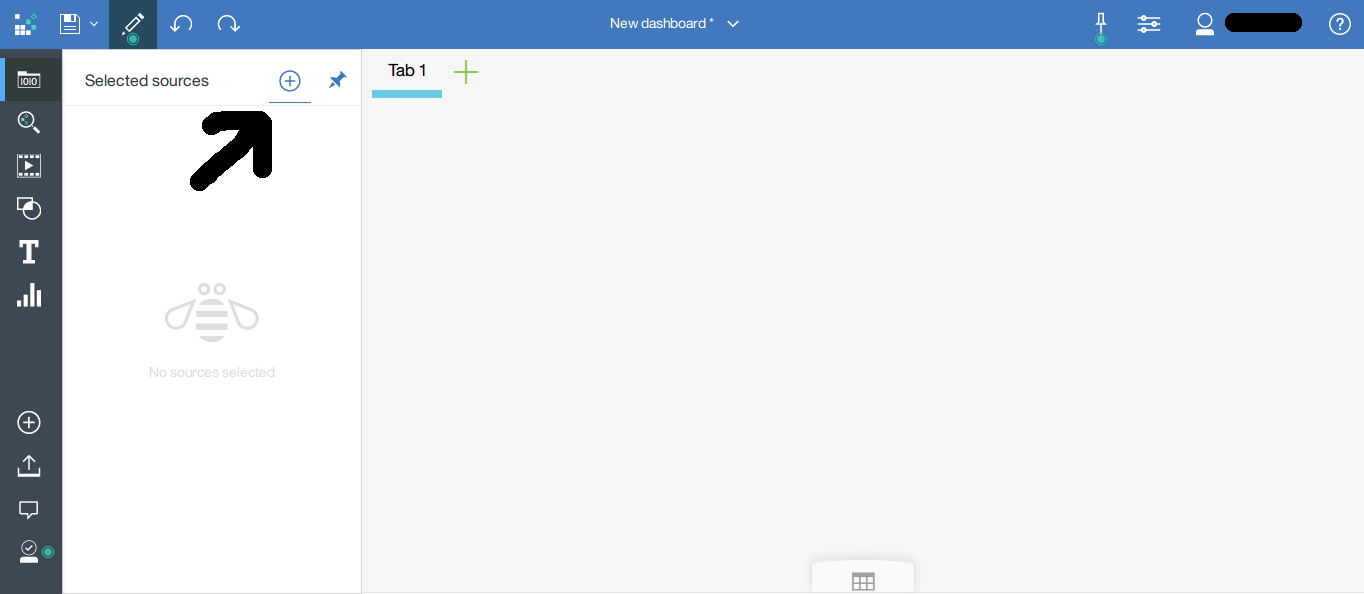
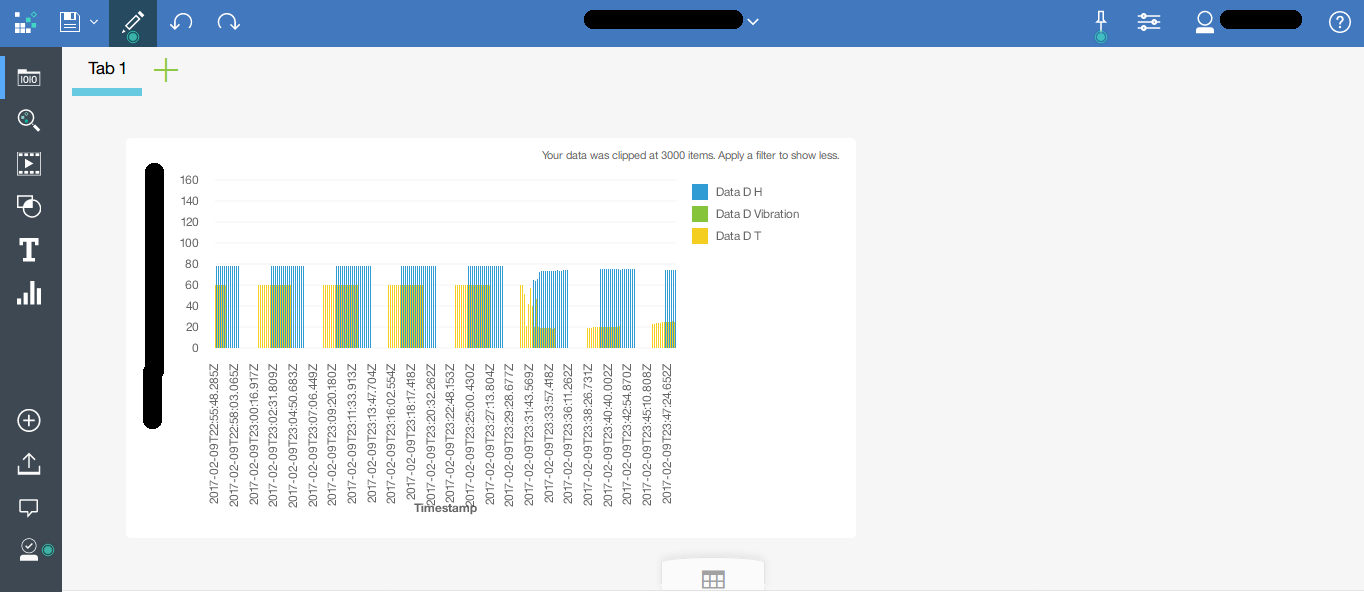
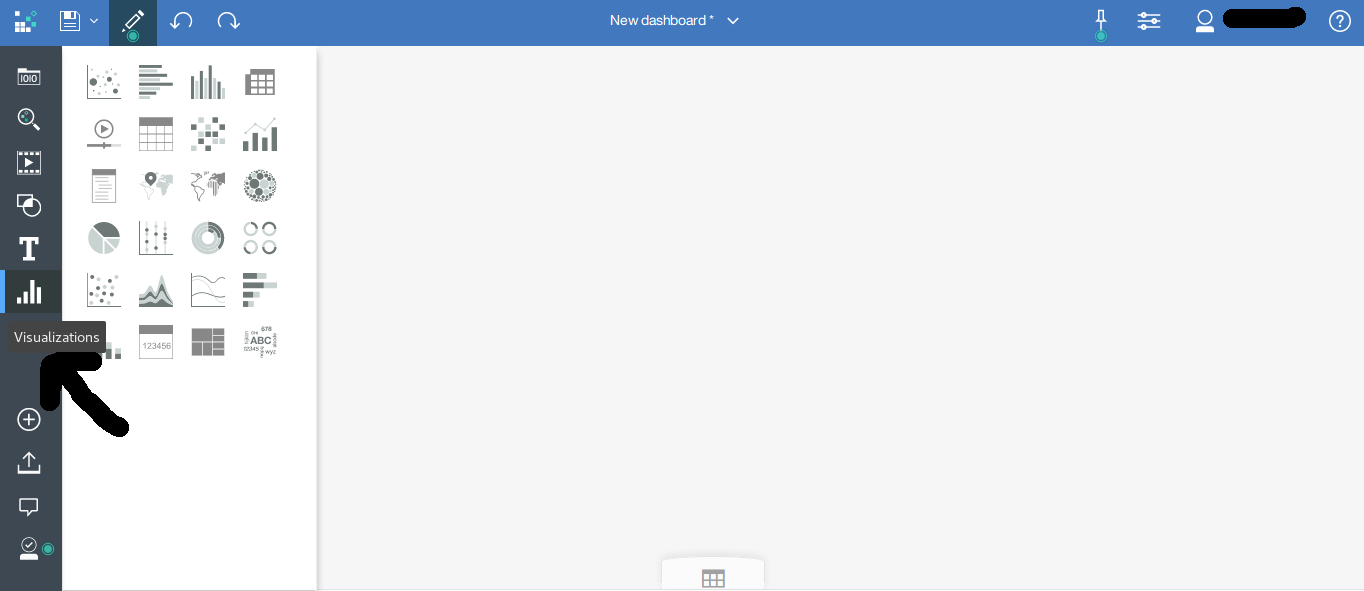
Finally , you can create your charts and process the DashDB data.Just drag and drop the values from your data source into your charts.
Enjoy !
Don’t forget to save your Dashboard , so you can consult it in the future.
Charts
In my project , I get data from sensors and I can see the temperature , humidity , noise values over time and I can also notice that the average temperature dropped dramatically while other values remained stable at a certain point of time.